MANTEC: Strengthening South Central Pennsylvania Manufacturing The numbers tell an uncomfortable story heading into summer.…

Pennsylvania manufacturing safety performance is lagging the national trend, and the gap is showing up on production schedules across the Commonwealth. According to the BLS Mid-Atlantic Information Office, Pennsylvania manufacturing recorded a Total Recordable Case rate of 3.3 cases per 100 full-time workers in both 2023 and 2024. Meanwhile, the national private-industry rate fell to 2.3 in 2024, the lowest level in the data series going back to 2003. In other words, Pennsylvania manufacturing safety statistics held flat while the rest of the country improved.
The raw numbers behind that rate are substantial. Manufacturers in the state logged 17,700 recordable injury and illness cases in 2024. Of those, 10,500 involved days away from work, job transfer, or restricted duty—the more severe category, commonly called DART cases, that pulls trained workers off Pennsylvania manufacturing safety zones for days, weeks, or longer. The state’s manufacturing DART rate hit 2.0 per 100 workers, well above the statewide private-industry DART rate of 1.6 and the national figure of 1.4. As a result, the Pennsylvania manufacturing safety pattern points to measurable consequences for output, customer commitments, and competitive standing.
The Hidden Downtime Behind Every Pennsylvania Manufacturing Safety Incident
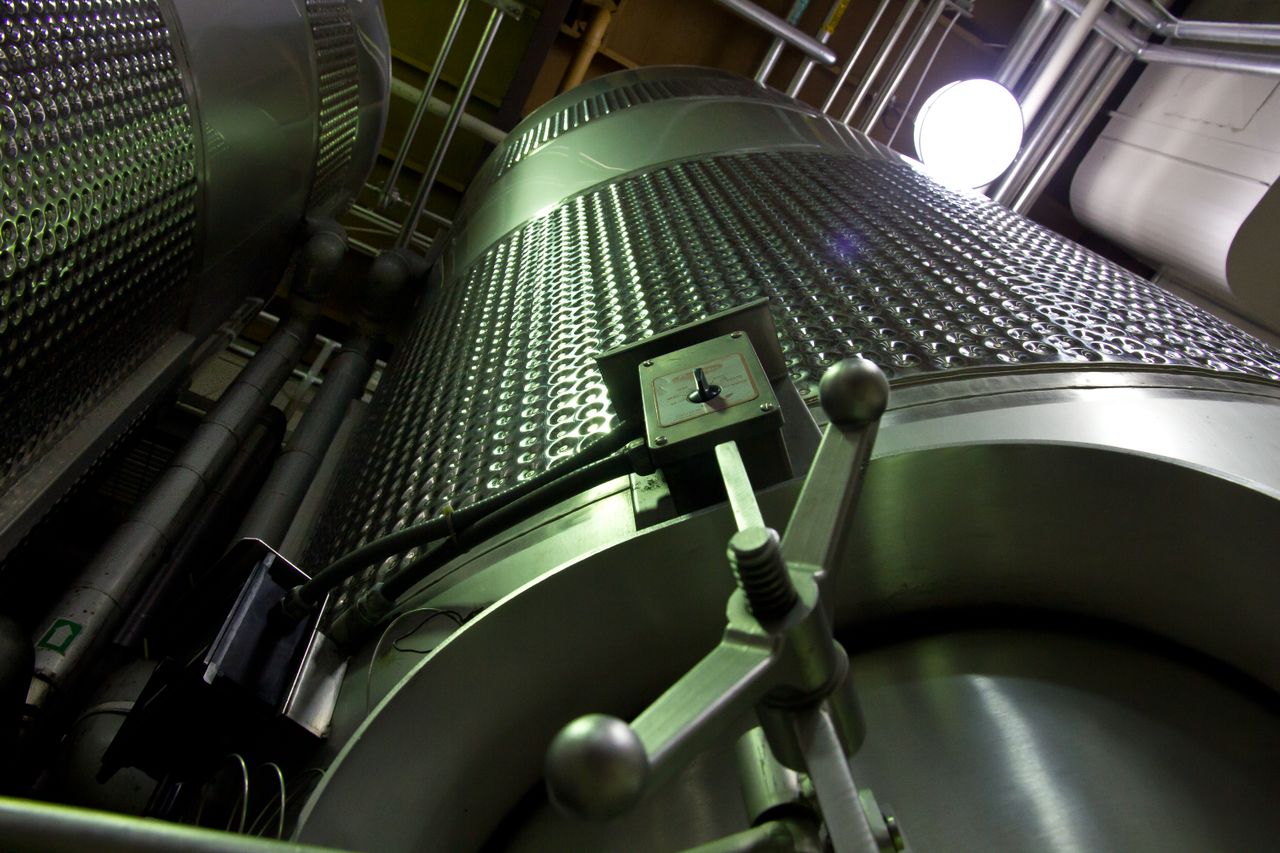
Operations leaders often treat unplanned downtime as a single bucket, lumping mechanical breakdowns, material shortages, and Pennsylvania manufacturing safety incidents together. However, that accounting masks a useful pattern. Downtime tied to injuries tends to cluster at the same workstations, around the same equipment, and during the same shifts. When plants map injury data against PA manufacturing safety reports and production data, the overlap rarely looks random.
Consider what happens after a worker is pinched between a conveyor and a guardrail. First, the line shuts down for incident response. Next, the area is sealed off for Pennsylvania manufacturing safety investigation, often for several hours. Then, the operation has to absorb a restricted-duty accommodation while the injured worker recovers. Finally, a replacement operator learns the position, and during that ramp-up period quality and pace both suffer. Each phase is a separate Pennsylvania manufacturing safety cost, but only the first one usually shows up in operational reports.
The hidden phases are often the most expensive. A plant that records two recordable injuries in a quarter may absorb three or four times that many shifts of partial productivity through the recovery and retraining cycles that follow. Catching those Pennsylvania manufacturing safety events before they cause harm requires structured reporting, a topic covered in Near-Miss Reporting Quick Guide for South Central PA Manufacturers.
OSHA’s Citation List Reads Like a Pennsylvania Manufacturing Safety Roadmap
The Occupational Safety and Health Administration’s 2024 workplace injury and illness data release, pulled from more than 370,000 employer reports submitted on Form 300A, gives manufacturers a public window into how peers report injuries. Alongside that data, OSHA publishes its annual list of most-cited standards, a benchmark that belongs on every Pennsylvania manufacturing safety leader’s desk. Regional Administrator Eric Harbin previewed the preliminary fiscal year 2025 list at the National Safety Council Congress in September 2025.
That list keeps the same general industry hazards at the top, and each one maps directly to a Pennsylvania manufacturing safety priority. Hazard communication drew 2,546 citations. Control of hazardous energy, better known as lockout/tagout, generated 2,177 PA manufacturing safety citations. Powered industrial trucks—forklifts and similar equipment that move material across nearly every Pennsylvania plant floor—drew 1,826. Machine guarding rounded out the top ten with 1,239. Notably, Harbin pointed out that plastic products manufacturers and machine shops led the industries cited for lockout/tagout violations, a Pennsylvania manufacturing safety profile that fits a substantial slice of the Commonwealth’s industrial base.
These citations are not just paperwork problems. Each one maps to a hazard category that, when uncontrolled, takes equipment offline. For example, a machine without proper guarding eventually injures someone, undermining Pennsylvania manufacturing safety performance. Similarly, a missing energy-control procedure eventually energizes equipment during maintenance. A hazard communication gap leaves workers unsure how to handle a chemical, slowing every transfer and cleanup. Therefore, the same conditions that draw OSHA fines also drive unscheduled stoppages, which means Pennsylvania manufacturing safety compliance and uptime are largely the same project viewed from different angles.
Pennsylvania Manufacturing Safety Performance by Plant Size
Pennsylvania’s BLS data carries a sharper warning for mid-sized manufacturers. While the statewide manufacturing TRC rate sits at 3.3, Pennsylvania manufacturing safety performance worsens as plants grow into the mid-size range. Specifically, establishments with 11 to 49 employees run at 3.4. Those with 50 to 249 employees climb higher still, to 3.8.
By contrast, the very smallest establishments, with fewer than 11 workers, post a Pennsylvania manufacturing safety rate of 2.0. Larger operations of 250 to 999 workers come in at 2.8, and plants of 1,000 or more sit at the same 2.8. The Pennsylvania manufacturing safety curve peaks in the mid-size band, and that’s where the operational consequences also hit hardest.
There are practical reasons for that pattern. Mid-sized PA manufacturing safety operations rarely employ a full-time safety manager. Additionally, they lack the redundant staffing needed to absorb restricted-duty workers without disrupting production. Furthermore, they often operate on margins where a single workers’ compensation premium increase can swallow a quarter’s worth of profit improvement work. Because of those constraints, mid-sized plants need structured, low-overhead Pennsylvania manufacturing safety programs more than any other segment of the industry.
Closing the Pennsylvania Manufacturing Safety Gap
Pennsylvania manufacturing safety performance is currently trailing the country at large, yet the elevated injury rate maps cleanly onto specific, addressable programs. To begin with, job hazard analyses identify the Pennsylvania manufacturing safety tasks driving most incidents. In addition, lockout/tagout procedures address the citation category leading the OSHA list for plastic products manufacturers and machine shops. On top of that, OSHA 30 training equips supervisors to recognize and correct the conditions that show up in injury and citation data. The structured approach to those Pennsylvania manufacturing safety programs is detailed in Job Hazard Analysis and Lockout/Tagout: Why OSHA’s Top Citations Stall South Central PA Production.
Plants that work through this Pennsylvania manufacturing safety roadmap don’t just lower their TRC numbers. Beyond that, they produce more uptime, smoother changeovers, and a workforce that surfaces problems early. Customers notice the difference in Pennsylvania manufacturing safety culture. So do prospective hires, who increasingly evaluate employers on visible safety practices. The same data that documents the Commonwealth’s gap also points to the path back, and the manufacturers who move first will be the ones holding production capacity when their competitors are still cleaning up after the next preventable incident.
MANTEC: Your Partner in Manufacturing Excellence
MANTEC helps South Central Pennsylvania manufacturers build the operational reliability that comes from getting safety right. Our team understands the regional industry and delivers practical solutions that protect workers and production at the same time.
Our Services Include:
- OSHA 30 Certification Training — Workplace safety certification covering Lockout/Tagout, Machine Guarding, Hazard Communication, and the rest of OSHA’s most-cited standards
- Health & Safety Advisory Services — Safety culture assessments, hazard reduction consulting, and compliance support
Ready to Reduce Downtime by Reducing Risk? Contact MANTEC to discuss how a structured safety program can protect your workforce and your production schedule.
Works Cited
“Employer-reported workplace injuries and illnesses in Pennsylvania — 2024.” U.S. Bureau of Labor Statistics, Mid-Atlantic Information Office, 18 Feb. 2026, www.bls.gov/regions/mid-atlantic/news-release/workplaceinjuriesandillnesses_pennsylvania.htm. Accessed 29 Apr. 2026.
“US Department of Labor releases 2024 injury, illness data.” Occupational Safety and Health Administration, U.S. Department of Labor, 17 Apr. 2025, www.osha.gov/news/newsreleases/osha-trade-release/20250417. Accessed 29 Apr. 2026.
Related Articles
Related Posts